The line is full, but with what?
When the internet slows down, the first suggestion is usually to upgrade the line. Yet the problem may be a backup job that starts at night and runs into the morning, hundreds of computers downloading updates, or a single user’s video stream. In that case, upgrading the line only increases the bill. Seeing that an interface is full is not enough; you need to know what is flowing through it.
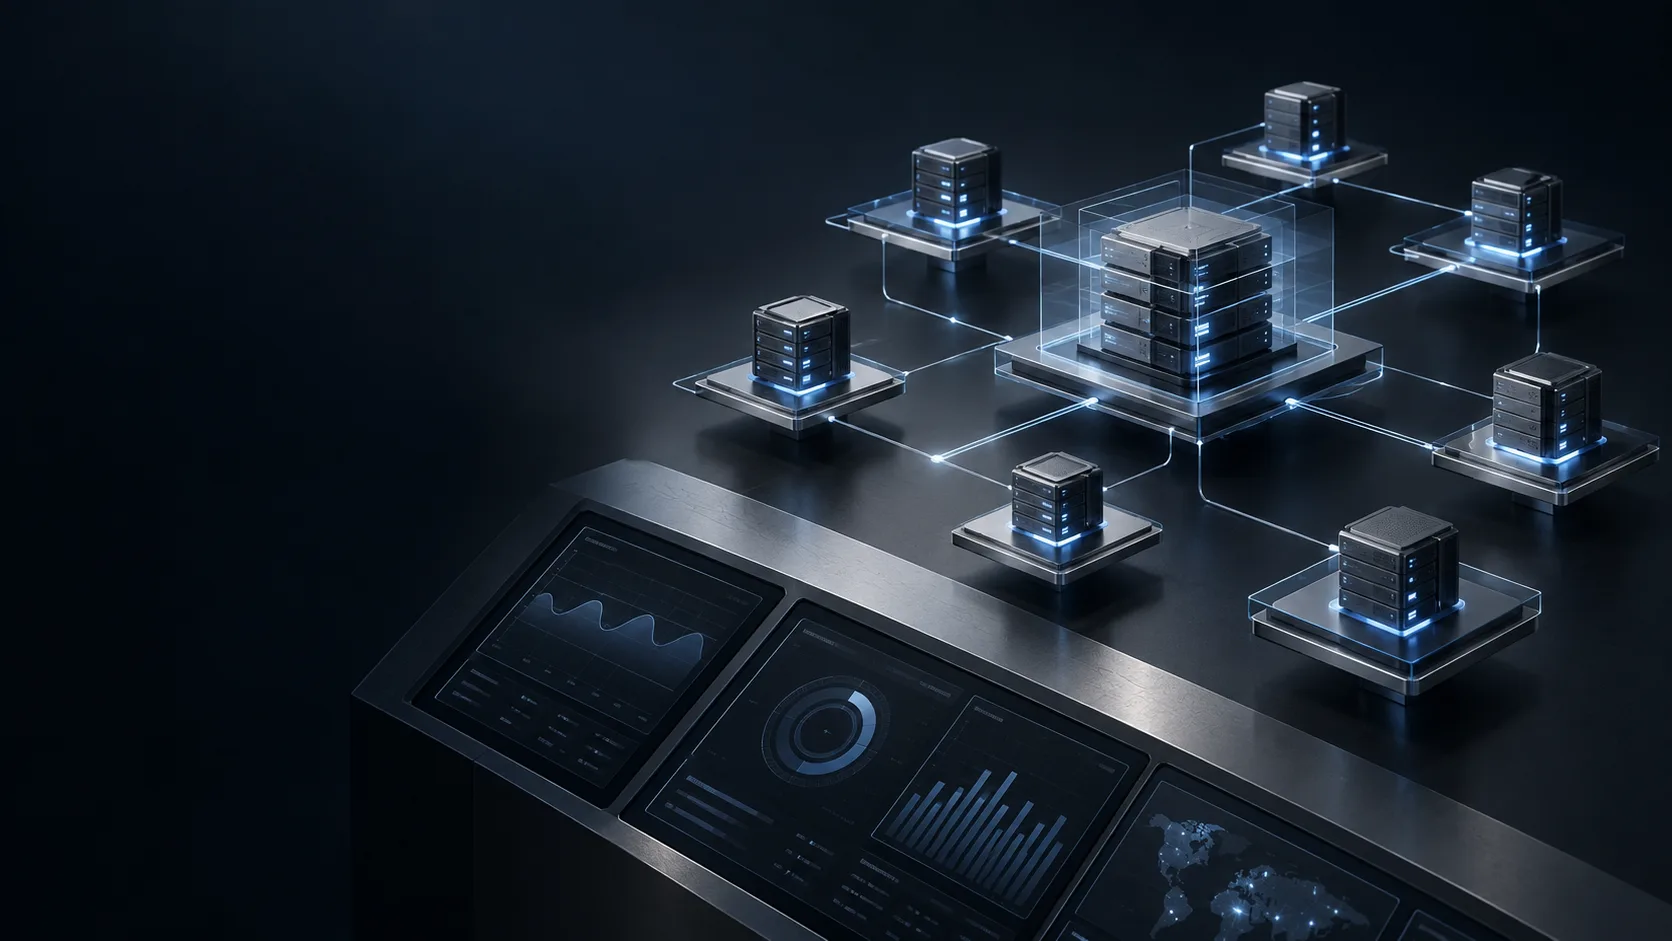
ManageEngine NetFlow Analyzer is traffic analysis software that collects and analyses the flow data generated by routers, switches and firewalls.
What does NetFlow Analyzer do?
Reads flow data from different vendors
It supports flow formats such as NetFlow, sFlow, IPFIX and J-Flow. In a network made up of different brands, traffic is gathered in a single console.
Recognises applications beyond port numbers
With NBAR support, applications that use dynamic ports are also classified. Deep packet inspection can measure application response times, helping you tell whether a slow ERP is caused by the network or the server.
Validates your traffic priorities
With Cisco CBQoS monitoring, you can see whether the quality of service policies you have set up are actually working. Traffic shaping can be used to prioritise critical users and applications.
Flags unusual traffic
Machine learning-based security analytics detects anomalies on the network and maps them to the MITRE ATT&CK framework. A computer sending large amounts of data out at midnight appears in front of you as an alert.
Helps you plan ahead
Capacity planning reports help you assess future needs from usage trends. Retrospective troubleshooting reports based on raw data and per-department billing reports can also be produced.
NetFlow Analyzer with Unna
- We listen first. We hear about your lines, your branches and the slowdowns users complain about most.
- We plan together. We decide which devices flow data will be collected from, and which interfaces and application groups will be monitored.
- We install and configure. We enable flow export on firewalls and switches, install NetFlow Analyzer and tailor the reports to your needs.
- We stay by your side. We regularly review traffic trends with you and support your line and capacity decisions with data.
Part of the whole
- On our network and server monitoring page, we explain where NetFlow Analyzer fits in the overall monitoring picture.
- OpManager tells you an interface is full; NetFlow Analyzer shows what it is full of.
- Firewalls such as FortiGate generate flow data; traffic analysis helps simplify security rules based on actual usage.
- With Firewall Analyzer, we interpret logs of allowed and blocked connections together with flow data.
Frequently asked questions
Does it see the content of traffic, such as emails or files?
No. Flow data shows who exchanged how much data with whom, over which port and protocol; it does not show content. Even so, because user-based reports may contain personal data, we recommend keeping access permissions limited.
Does flow data slow down the network?
Flow export creates additional workload on the device. On busy devices, we adjust the sampling rate and the interfaces to be monitored accordingly.